Data Science and Visual Computing
A book everyone interested in big data and visualization should read.
We are awash in data; it’s like the weather, we know it, we can’t manage it. We are struggling to get a grip on it, understand it, use it and exploit it, but it is being generated faster than we can harness it. Data has always been available to us; the difference now is that it is all (or most of it) in digital form, and therefore easier to store—and we are storing, saving every last bit it seems. The data comes from credit card transactions, the sale of everything and anything you can think of, remote sensors and the Internet of Things, simulations, scientific experiments, monitoring of business processes, security data, social media, recording devices and more.
Global data is increasingly complex and heterogeneous, and is predicted to rise to over 100 zettabytes—that’s the equivalent of 10 billion PCs disk drive—10 billion.
Not only is the volume already huge and increasing, but it is also ever more important due to safety, security, and forensics.
The methods are not new and include data analysis, simulation, and interactive exploration using 2D and 3D visualization techniques. What is new is the user-friendliness, ease of use, and most importantly, the compatibility of data. Whereas data from entity A could never be read by entity B, those artificial barriers are being swept away by a combination of international standards cooperation, more robust file translation programs and AI which is used to help decipher the intent and context of the data to make it more useful. The need to get a grip on all this data across a variety of disciplines has led to the formation of national and institutional Data Science Institutes and Centers. Driven by national priority, they attract support for research and development within their organizations and institutions to bring together interdisciplinary expertise to address a wide variety of problems. And visual computing is the set of tools and methodologies used to extract information from data.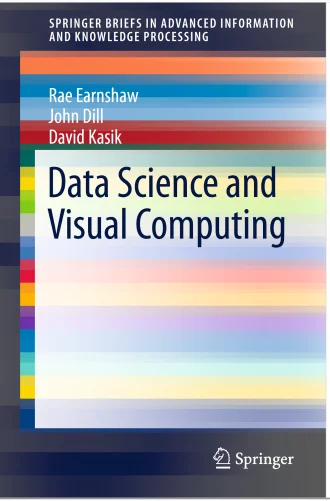
These are big ideas, and big developments that are needed and demanded by the onslaught of all the big data.
This book, Data Science and Visual Computing, pulls together the work of experts, academicians, commercial and scientific researchers, and developers into one volume. It’s designed to be a reference and it provides guidance on understanding the meaning and impact of visualizing big data as a methodology of managing it. Humans are visual processors. We understand things by seeing the relationship between the various elements. Translating mind-numbing data into images helps us understand it, see the differentials, discover the trends, and anticipate the problems. Data Science and Visual Computing will show you what’s being done, what’s being worked on and give you some hope and confidence that yes we can get a grip on the flood of data and put it to use for our benefit. For those who want more detail on current R&D, there is a list of Further Reading and a comprehensive set of References.
Editor: Jon Peddie
熱門頭條新聞
- SIGGRAPH Asia 2026 Takes Shape: Distinguished Keynote Speaker Line-up Unveiled
- Apple Completes App Store Leadership Transition; New Management Pursues Higher Margins, Phil Schiller Steps Back From Day-to-Day Operations
- Apple’s new EU App Store Business Terms Still Violate the Digital Markets Act (DMA).
- Lost and Found Co. Developer Bit Egg Becomes First Game Studio to Win Thailand’s Prestigious Prime Minister’s Export Award
- DRAGONHEIR: SILENT GODS MARKS THIRD ANNIVERSARY WITH COMMUNITY-CREATED HERO AND ORDER VS. CHAOS SHOWDOWN
- China Domestic Animation Summer Season 2026 Review: Box-office Boom for Theatrical Animation, Established Web Series Face Headwinds, AI Man-Dramas Explode for New Growth
- Tianji: Shadow of the Ancients, Coming 2027 to Multiple Global Platforms
- China’s Anime-Goods (“Guzi”) Economy 2026 Market Review